Reading the Tape: How Volume Divergence Exposes Institutional Moves Before Price Confirms
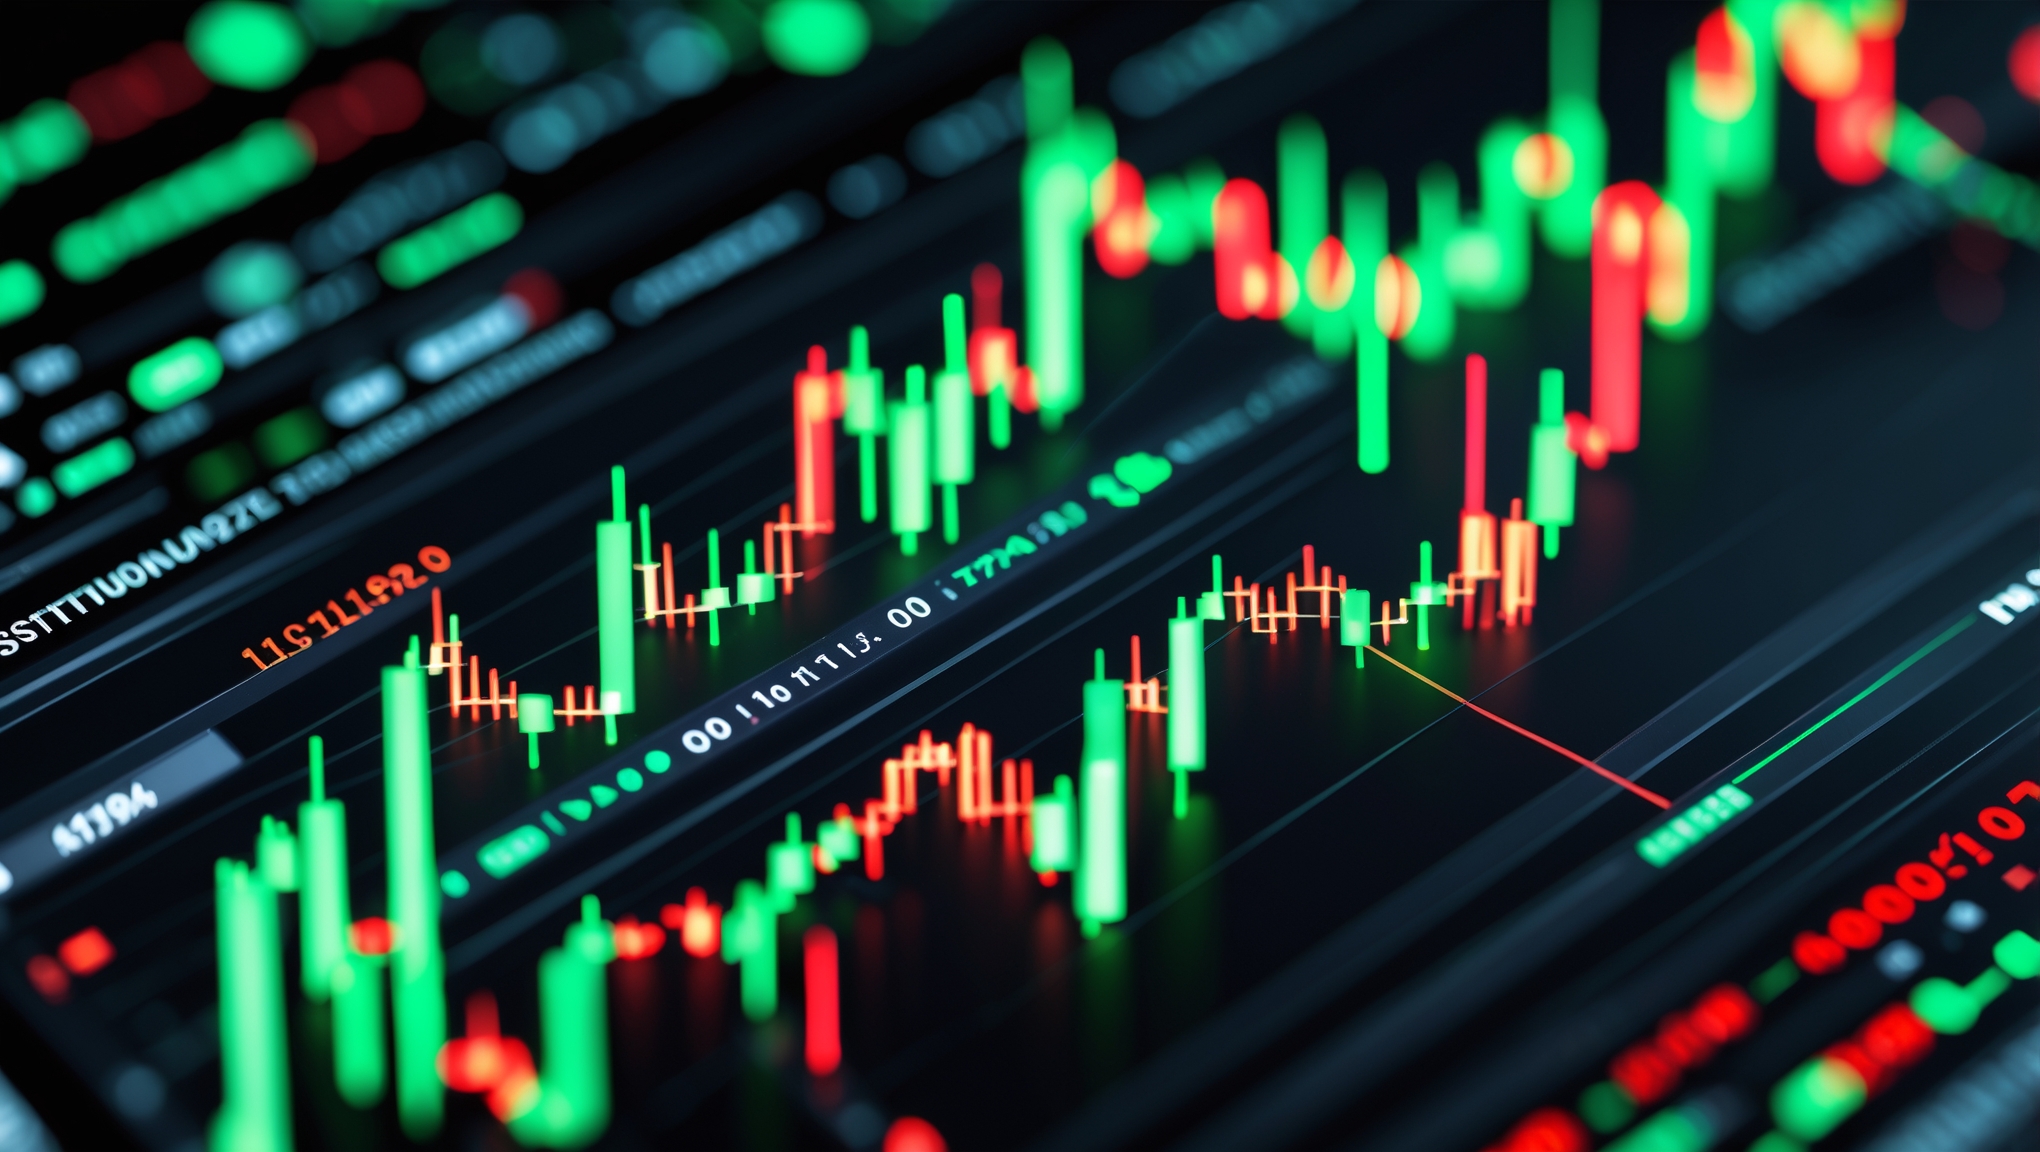
Price lies. Volume doesn't. Understanding volume divergence is one of the highest-leverage skills in crypto analysis — and the second most important factor in the InDecision Framework.
There's an old Wall Street saying: price is what you pay, value is what you get.
In trading, there's an equivalent: price is what you see, volume is what's real.
Volume analysis is the second-highest-weighted factor in the InDecision Framework at 25%, sitting just behind Daily Pattern Analysis. It earned that weight because it is the most manipulation-resistant signal available to retail traders. You can fake a candle. You can paint a chart. You cannot fake volume in a liquid market over any meaningful time period.
The Divergence Principle
Price-volume divergence is the most powerful signal in the framework. It works like this:
- Bullish divergence: Price falls, but volume on down candles is decreasing. Translation: the selling pressure is exhausting itself. Fewer sellers at lower prices. A reversal is loading.
- Bearish divergence: Price rises, but volume on up candles is decreasing. Translation: the rally is losing conviction. Buyers are stepping back. A fade is incoming.
This sounds simple. It is conceptually simple. Executing it profitably requires understanding what "divergence" actually means in the context of crypto markets, which behave differently from equities.
Crypto Volume Has a Context Problem
In equity markets, volume is relatively straightforward. You're looking at shares of a single stock.
In crypto, you're dealing with:
- Spot volume across dozens of exchanges
- Perpetual futures volume (often 3-5x spot)
- Options flow
- On-chain transaction volume
InDecision's Volume Analysis factor synthesizes across these layers. Raw exchange volume is the starting point, but the signal gets much sharper when you look at relative volume — current volume compared to the 30-day rolling average.
A 2.5x average volume rally looks very different from a 0.4x average volume rally, even if the price move is identical. The high-volume move is real. The low-volume move is suspicious.
Smart Money Flow vs. Retail Momentum
The most useful application of volume analysis is detecting smart money accumulation before it becomes visible in price.
Smart money accumulation looks like:
- Steady, above-average volume over multiple sessions with sideways or slightly up price action
- Large block trades on the bid side (visible in order book depth and tape)
- Spot volume leading futures volume (smart money buys spot first, then futures leverage follows)
Retail momentum looks like:
- Explosive volume spike as price goes vertical
- Futures volume far exceeding spot volume
- Social media engagement hitting its peak during the move, not before it
By the time a move is on CNBC or trending on X, the smart money is thinking about exits. Volume analysis lets you distinguish which stage of the cycle you're in before you commit capital.
The 4.2x Signal
When InDecision detects price movement on 4x or more average volume, the conviction multiplier kicks in across the entire framework. Direction is confirmed more strongly. The framework upgrades the bias from "likely" to "high conviction."
The inverse is equally important: when InDecision sees price move significantly on below-average volume (say 0.5x), the bias is flagged as low conviction regardless of the directional signal. A move without volume participation is a move without institutional backing. Those moves reverse.
The 67% accuracy figure in the framework is significantly influenced by this filter. We are not taking low-volume signals seriously.
What Volume Divergence Won't Tell You
Volume analysis is not a timing tool. It tells you that a move is real or suspect. It does not tell you precisely when the reversal comes.
That's why it's 25% of the framework, not 100%.
Volume analysis gets stacked with Daily Pattern Analysis (which handles the when), Timeframe Alignment (which handles the direction confirmation), and Market Timing (which handles the session context). Together, they produce a conviction score that's worth acting on.
Alone, any single factor is noise. Together, they are signal.
Weekly InDecision signals include the full volume analysis breakdown for every call. Subscribe to see exactly how the tape is being read each week.
Explore the Invictus Labs Ecosystem
// FOLLOW THE SIGNAL
Follow the Signal
Stay ahead. Daily crypto intelligence, strategy breakdowns, and market analysis.
Get InDecision Framework Signals Weekly
Every week: market bias readings, conviction scores, and the factor breakdown behind each call.